Nitro C# APIs for Command Center – Scripting with PowerShell

In my previous post on the Nitro APIs for NetScaler I shared some PowerShell examples for interacting with a NetScaler using the Nitro C# API SDK in PowerShell. I wanted to share some similar tips and samples for scripting with the Command Center APIs, which has quite a few more gotchas than the NetScaler APIs (in my opinion :).

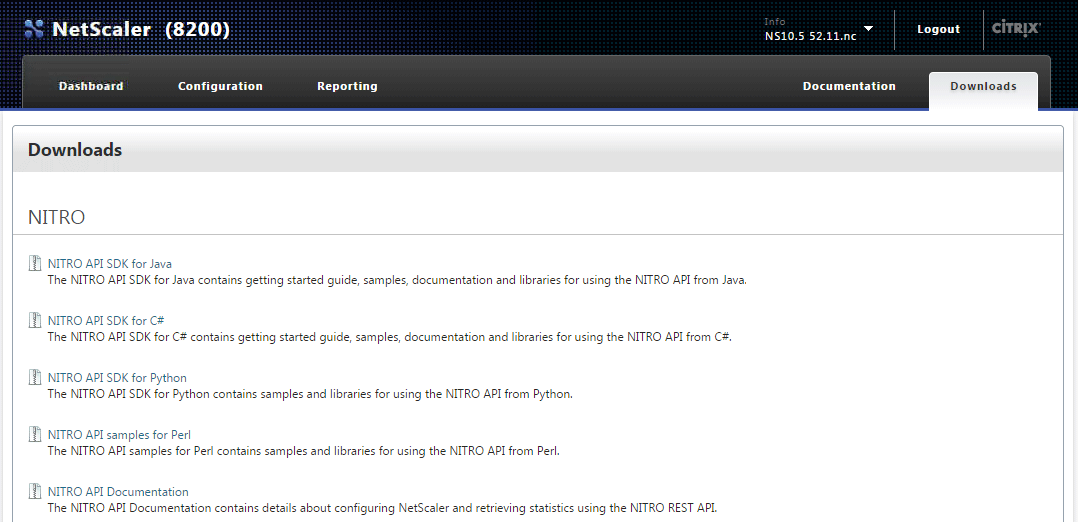
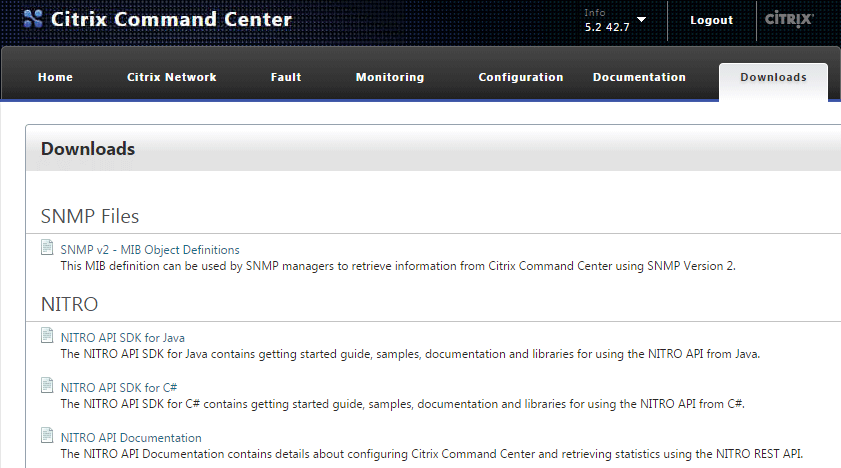
Loading the Command Center version of the Nitro C# framework in PowerShell is about the same as the NetScaler. Just like on the NetScaler, the needed assemblies can be found at the ‘Downloads’ section on the Command Center web console:

Command Center Downloads

Download and extract the tarball to your scripting environment’s working directory. Next, add the Command Center Nitro .NET framework into your runspace using the Add-Type cmdlet:

Add-Type -Path .\newtonsoft.json.dll
Add-Type -Path .\cmdctr_nitro.dll

The last requirement, which is not needed with the NetScaler APIs, is to copy ccapi.xml to your $HOME directory:

Copy-Item -Path .\ccapi.xml -Destination $HOME

If you don’t have this file in your $HOME directory you’ll get an exception when attempting to connect to the server. To do so, use com.citrix.cmdctr.nitro.service.nitro_service.login(UserName, Password):

$Credentials = Get-Credential
$nitrosession = new-object com.citrix.cmdctr.nitro.service.nitro_service($ccserver,8443,"https")
$nitrosession.login($Credentials.GetNetworkCredential().UserName, $Credentials.GetNetworkCredential().Password)

Once logged in the class heirarchy is very similar to the NetScaler APIs. Let’s look at a couple of examples of what you can do from here with some code snips along the way.

The primary reason that I wanted to write a script against Command Center was to run batches of tasks against a list of NetScalers and variables. In the script I took two such csv lists as parameters loop on each to execute the tasks sequentially against each NetScaler in the list.In this example I’ll show you how to run a custom task and passing values to populate the task’s ‘UserInput’ variables.

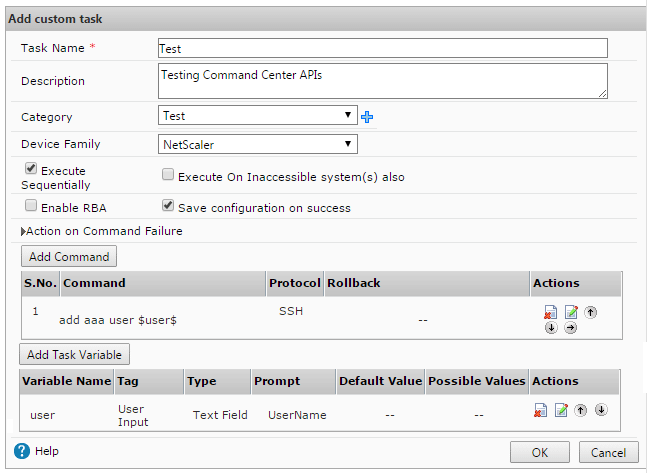
First, create a custom task in Command Center, in this example we’ll add a user that’s passed as a variable $user$:

Command Center Custom Task

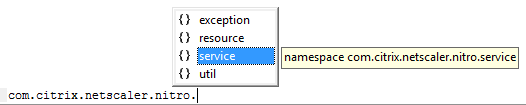
In your PowerShell runspace load the following cmdctr.nitro.resource.configuration objects; ns_task_execution_data to get the task’s UserInput values, an ns_task of the task that will be executed, and a scheduler_data to specify how it should be execute:

$taskname = "Test"
$user = "User1"
$nsip = "10.0.0.1"
$task = New-Object com.citrix.cmdctr.nitro.resource.configuration.ns_task_execution_data
$taskdetails = [com.citrix.cmdctr.nitro.resource.configuration.ns_task]::get($nitrosession, $taskname)
$taskschedule = New-Object com.citrix.cmdctr.nitro.resource.configuration.scheduler_data
$taskschedule.recurr_type = "no_reccur"

From here we’ll need to put the user variable into the $task.user_input_props property. To do this you’ll need to build an explicit Dictionary[System.String,System.String] object:

$userinputprops = New-Object "System.Collections.Generic.Dictionary``2[System.String,System.String]"

Next, assign the user name variable taskdetails.task_variable_list[0].name dictionary entry. Note that the format is very specific here, most notably explicit single quotes around $UserInput$ to make sure the $’s stay in the string:

$userinputprops['$UserInput$' + $taskdetails.task_variable_list[0].name] = $user)

Since there’s only one variable in this task, we can set the $task.user_input_props property using ns_taskexecution_data.set_user_input_props(), but would otherwise do a for loop on the $taskdetails.task_variable[] array to assign multiple variables:

$task.set_user_input_props($userinputprops)

Now fill out a few other task properties, including the user who ran the job, an annotation notating the computer it was executed from, the target NetScaler IP to run the task against

$task.task_name = $taskdetails.name
$task.executed_by = ($Credentials.UserName).Split('\')[1]
$task.scheduler_data = $taskschedule
$task.annotation = "Nitro automated task executed from $($env:COMPUTERNAME)"
$task.device_list = $nsip

Then execute the task using the execute() method of the ns_task_execution_data class, passing the $task object as the second parameter:

$task = [com.citrix.cmdctr.nitro.resource.configuration.ns_task_execution_data]::execute($nitrosession,$cctask)

This will start the task in Command Center, which can then be monitored by calling get() in ns_task_status:

$taskstatus = [com.citrix.cmdctr.nitro.resource.configuration.ns_task_status]::get($nitrosession, ($cctask.execution_ids)[0])

You can then do a while/start-sleep loop on $taskstatus.status to find out what happened:

Do { $taskstatus = [com.citrix.cmdctr.nitro.resource.configuration.ns_task_status]::get($nitrosession, ($cctask.execution_ids)[0])
Start-Sleep -Seconds 1 }
While ($taskstatus.status -match "Progress" -or $taskstatus.status -match "Queued")

Once the task is complete, check the status of what happened:

if ($taskstatus.status -eq "Success")
{ Write-Host "$($cctask.task_name) completed on $nsip" }

As always it’s a lot easier to deal with a success than a failure, here’s wait it takes to see what command failed, and what the error was, if the task faced a conflicting config:

if ($taskstatus.status -eq "Failed")
{	
 $ccfilter = New-Object com.citrix.cmdctr.nitro.util.filtervalue
 $ccfilter.properties.Add("id",$taskstatus.taskexecution_id + "")
 $errorlog = [com.citrix.cmdctr.nitro.resource.configuration.command_log]::get_filtered($nit rosession,$ccfilter)
 $failedcmd = ($errorlog.output.Split("`n")[2] -replace "`n|`r").Split(':')[1]
 $failedmsg = ($errorlog.output.Split("`n")[3] -replace "`n|`r").Split(':')[1] 
 Write-Host "$($cctask.task_name) failed at '$failedcmd', the error was '$failedmsg'"	
}

I hope this example was useful and that you enjoyed a second Nitro boost for your Citrix scripting repertoire!

Nitro C# APIs for NetScaler – Scripting with PowerShell

Hello again! It’s been a while, I know, but I’m back with some fresh goodness that I hope you will enjoy. I want to give a quick shout out to Thomas Poppelgaard for encouraging me to share some new content, and in return I promised him that I’ll dust off SiteDiag in the near future 🙂 Since my last post I joined a financial services firm where I’ve been working on a global NetScaler deployment, so I’ve got lots of great insights about NetScaler and Command Center that I wanted to share.

During my involvement on the engineering side of a larger NetScaler deployment I came across several situations that warranted scripts for both NetScaler and Command Center. The primary driver behind these scripts was the automation of configuration deployment and management (comparing and setting configurations against lists of NetScalers). This post aims to cover the basics of using the C# Nitro APIs in PowerShell. I also hope to share similar tips on the Command Center APIs in a future post.

So, to get started scripting you’ll need to download and extract the Nitro API SDK for C# to the host where you plan to run the script. The download is hosted on the NetScaler itself under the ‘Downloads’ section (on the far right in 10.5):

NetScaler API SDK Downloads

NetScaler API SDK Downloads

Once you’ve extracted everything out you’ll have two DLLs that will need to be loaded into your PowerShell environment, newtonsoft.json.dll and nitro.dll. To ‘include’ these runtime libraries in your script, simply use the Add-Type cmdlet for each:

Add-Type -Path .\newtonsoft.json.dll
Add-Type -Path .\nitro.dll

Now that the runtime libraries are included you can directly call the Nitro objects using the com.citrix.netscaler.nitro namespace:

com.citrix.netscaler.nitro Namespace


The next step is to connect to the NetScaler by creating com.citrix.netscaler.nitro.service.nitro_service object and calling the login() method, which looks like this in PowerShell:

$Credentials = Get-Credential #prompt for credentials
$nitrosession = New-Object com.citrix.netscaler.nitro.service.nitro_service("netscaler.fqdn",'HTTPS') 
$nitrosession.login($Credentials.GetNetworkCredential().UserName, $Credentials.GetNetworkCredential().Password)

And this is where the ‘fun’ starts. Referencing the Nitro API Documentation, you can explore all of the classes and methods that are now at your disposal, including every imaginable configuration and statistic.

Let’s take an example of checking the status of modes, which is handled by the com.citrix.netscaler.nitro.resource.config.ns.nsmode class:

com.citrix.netscaler.nitro.resource.config.ns.nsmode


Say you wanted to get all of the modes that are currently set on a NetScaler, you’d simply call the get() method, passing the $nitrosession object as the only argument:

[com.citrix.netscaler.nitro.resource.config.ns.nsmode]::get($nitrosession)

mode : {FR, L3, MBF, Edge...}
fr : True
l2 : False
usip : False
cka : False
tcpb : False
mbf : True
edge : True
usnip : True
l3 : True
pmtud : True
sradv : False
dradv : False
iradv : False
sradv6 : False
dradv6 : False
bridgebpdus : False

This command uses the nitro_service object as the connection reference for the nsmode.get() method, pretty straightforward.

Now, say you wanted to change one of the modes, L2 in this example, and this is where it can get a little tricky. First, you’ll need to store nsmode in a PowerShell object using the same get() method above:

$nsmode = [com.citrix.netscaler.nitro.resource.config.ns.nsmode]::get($nitrosession)

Then you’ll need to build an array of modes that you want to enable, including any that are already enabled, to pass to the enable() method (there’s probably an easier way to do this than the below snippet, but hey, it works!):

$modes = @(); foreach ($mode in $nsmode.mode){$modes += $mode}; $modes += "L2"

This will give you an array ($modes) that contains all of the modes that you want to enable, plus the modes that were already enabled. You’ll then need to use the nsmode.set_mode() method to set the modes that should be passed to the enable() method:

$nsmode.set_mode($modes)

And the moment of truth, passing the modified $nsmode object to the enable() method:

[com.citrix.netscaler.nitro.resource.config.ns.nsmode]::enable($nitrosession, $nsmode)
errorcode  message sessionid severity 
---------  ------- --------- -------- 
0         Done              NONE

Let’s explore another example that involves a rewrite policy and action set, which can quickly become a web of interconnecting classes and methods.

First, let’s put all of the rewrite policies into an object:

$rewritepolicies = [com.citrix.netscaler.nitro.resource.config.rewrite.rewritepolicy]::get($nitrosession)

Which will give you a collection of rewrite policy objects in the following format:

__count : 
name : ns_cvpn_sp_js_vgp_pol
rule : http.req.url.path.endswith("ViewGroupPermissions.aspx") && http.req.method.eq(POST) && http.res.body(10).contains("0|/")
action : ns_cvpn_sp_ct_rw_act
undefaction : 
comment : 
logaction : 
newname : 
hits : 0
undefhits : 0
description : 
isdefault : True
builtin :

From here, you can call other methods for the rewrite class by referencing the object that you’re interested in. For example, to get a list of bindings for ns_cvpn_default_bypass_url_pol, which is the first policy returned on a NetScaler, you would reference $rewritepolicies[0].name when using the rewritepolicy_binding.get() method:

[com.citrix.netscaler.nitro.resource.config.rewrite.rewritepolicy_binding]::get($nitrosession, $rewritepolicies[0].name)

Similarly, you can get a rewrite action by referencing the rewrite policy’s action property:

[com.citrix.netscaler.nitro.resource.config.rewrite.rewriteaction]::get($nitrosession,$rewritepolicies[0].action)

I’ll stop here for the sake of time and complexity, as there are so many ways that you can go with this foundation. I highly recommend using a tool like PowerGUI so that you can see the classes as you type, and explore the various objects and methods at your disposal.

Anyways, I hope this all makes enough sense for someone to start scripting for NetScalers in PowerShell, and will try to post a similar article on the Command Center APIs soon.

XenApp PowerShell Scripting with Get-XASession

I was working on a PowerShell script in XenApp today to quickly view active sessions by user, server, application, and session duration. Having focused most of my PoSH time in recent years to the XenDesktop SDK, I was somewhat disappointed with the limited flexibility (and official documentation) of the XenApp SDK, specifically with the Get-XASession cmdlet.

My main complaint is that Get-XASession doesn’t have many ‘Required’ parameters, which means that queries are limited to a subset of session details:

Get-XASession

For example, if I want to find all sessions that are ‘Active’, I have to pipe the results of Get-XASession and evaluate each returned object. So, the following pipeline evaluation is required if you wanted to see all active sessions:

Get-XASession | Where-Object { $_.State -match 'Active'}

Using this as a foundation to find Active sessions, I took it a step further by using an input parameter (application name) to list sessions by application, and then formatted the output of the session details to get me what I’m looking for:

param ([String]$app)
foreach ($session in (Get-XASession | Where-Object { 
$_.BrowserName -match $app -and $_.State -match 'Active'} | 
select AccountName, ServerName, LogonTime, ConnectTime, CurrentTime, SessionID | 
Sort-Object LogonTime -Descending))
{
 $logon = (Get-Date) - $session.LogOnTime
 $connect = (Get-Date) - $session.ConnectTime
 "$($session.AccountName) logged on to $($session.ServerName) {0:00}:{1:00}:{2:00}" 
 -f $logon.Hours,$logon.Minutes,$logon.Seconds + " ago."
}

This script returns a active sessions by user name, connected to $app, the server on which it’s running, and the elapsed time (in ascending order) since they logged on (just subtract the $_.LogonTime date/time object from Get-Date). Notice how the $session object is compiled of properties of the sorted Get-XASession output by way of piping the output through several filters, which lets you create your own objects that can be easily manipulated and cross-referenced in the script. I also did some date/time formatting with {0:00}:{1:00}:{2:00}” -f $logon.Hours,$logon.Minutes,$logon.Seconds, though you can present this time duration in any way that makes sense.

Well, I hope this was worth a quick read, have a good weekend!

XenDesktop 7 Service Instances – What’s New?

Since XenDesktop 7 was built using the same service framework architecture as XenDesktop 5 (aka the ‘FlexCast Management Architecture’), the additional functionality introduced in XD7 was added as services, each with multiple service instances. These services are handled much in the same way as XenDesktop 5, and XenDesktop 7 sites use version 2 of the Citrix.Broker.Admin PowerShell SDK to return information on registered service instances using the cmdlets of the same name as XD5 (Get-ConfigRegisteredServiceInstance, Register-ConfigServiceInstance, etc.).

In XenDesktop 5, each DDC in a site has 5 services, with 12 total service instances that correspond to the various WCF endpoints used by each service. If the DDC is also running the Citrix License Server, there would be a total of 13 instances. For this reason, it’s a fairly straightforward process to find and register missing service instances.

XenDesktop 7 is quite different in this regard. Since it has optional FMA services, such as StoreFront, the number of service instances in any given site depends on which components are installed, and whether or not SSL-is in use.

For example, my single-DDC site running StoreFront 2.0 with SSL encryption has 10 services with 43 total service instances:

XenDesktop 7 Services

If StoreFront wasn’t installed, for example, there would be at least three less services (some of the Broker services would likely not be registered). There are also duplicate service instances for SSL encrypted services, such as the virtual STA service. Here’s a quick PoSH script to tell you what service instances are registered in your site (for XD5 & XD7):

asnp citrix.Broker*
Get-ConfigRegisteredServiceInstance -AdminAddress na-xd-01 | %{ 
"ServiceType: " + $_.ServiceType + " Address: " + $_.Address; $count++}
"Total Instances: " + $count

You could take this a step further to see how many instances are in each of the 10 possible service types:

New-Alias grsi Get-ConfigRegisteredserviceInstance
 $acct = grsi -AdminAddress na-xd-01 -serviceType Acct; "$($acct.Count) ADIdentity service instances"
 $admin = grsi -serviceType Admin ; "$($admin.count) Delegated Admin service instances"
 $broker = grsi -serviceType Broker; "$($broker.count) Broker service instances"
 $config = grsi -serviceType Config; "$($config.count) Configuration service instances"
 $envtest = grsi -serviceType EnvTest; "$($envtest.count) Environment Test service instances"
 $hyp = grsi -serviceType Hyp; "$($hyp.count) Hosting Unit service instances"
 $log = grsi -serviceType Log; "$($log.count) Configuration Logging service instances"
 $monitor = grsi -serviceType Monitor; "$($monitor.count) Monitor service instances"
 $prov = grsi -serviceType Prov; "$($prov.count) Machine Creation service instances"
 $sf = grsi -serviceType Sf; "$($sf.count) StoreFront service instances"
 "$($acct.Count + $admin.Count + $broker.Count + $config.Count + $envtest.Count + $hyp.Count + $log.Count + $monitor.Count + $prov.Count + $sf.Count) Total service instances"
XenDesktop 7 Service Instance Count

XenDesktop 7 Service Instance Count

Because of this nuance, I’m working on a more intelligent way of enumerating and validating service instance registrations in SiteDiag for XD7. Hopefully these scripts are helpful in illustrating the difference between XD5 & XD7. Also, here’s the latest nightly build of SiteDiag that has the beginnings of the additional logic needed to properly count, and fix, registered service instances in a XenDesktop 7 site.

XenDesktop 7 – Environment Test Service

If you’ve had a chance to review the XenDesktop 7 PowerShell SDK documentation, you might have noticed a few new snap-ins that provide the site interactions for the new services included with XenDesktop 7 (as part of the FlexCast Management Architecture). These new snapins are the designated as V1 on the cmdlet help site, and include StoreFront, Delegated Admin, Configuration Logging, Environment Tests, and Monitoring.

Out of these new services, the Environment Test Service sounds the most appealing to me, as it provides a framework to run pre-defined tests and test suites against a XenDesktop 7 site. However, I found that the SDK documentation didn’t provide much/any guidance on using this snap-in, so I thought I’d share a quick rundown on the meat of this new service, along with some sample scripts using the main cmdlets.

The most basic function of this service is to run predefined tests against various site components, configurations, and workflows. As of XD7 RTM, there are 201 individual TestID’s, which can be returned by running the Get-EnvTestDefinition cmdlet:

TestId 
------ 
Host_CdfEnabled 
Host_FileBasedLogging 
Host_DatabaseCanBeReached 
Host_DatabaseVersionIsRequiredVersion 
Host_XdusPresentInDatabase 
Host_RecentDatabaseBackup 
Host_SchemaNotModified 
Host_SnapshotIsolationState 
Host_SqlServerVersion 
Host_FirewallPortsOpen 
Host_UrlAclsCorrect 
Host_CheckBootstrapState 
Host_ValidateStoredCsServiceInstances 
Host_RegisteredWithConfigurationService 
Host_CoreServiceConnectivity 
Host_PeersConnectivity 
Host_Host_Connection_HypervisorConnected 
Host_Host_Connection_MaintenanceMode...

The tests are broken down into several functional groups that align with the various broker services, including Host, Configuration, MachineCreation, etc, and are named as such. For example, the test to verify that the site database can be connected to by the Configuration service is called Configuration_DatabaseCanBeReached.

Each test has a description of it’s function, and a test scope that dictates what type of object(s) can be tested. Tests can be executed against components and objects in the site according to the TestScope and/or TargetObjectType, and are executed by the service Synchronously or Aynchronously, depending on their InteractionModel. You can view all of the details about a test by passing the TestID to the Get-EnvTestDefinition cmdlet; for example:

PS C:> Get-EnvTestDefinition -TestId Configuration_DatabaseCanBeReached

Description : Test the connection details can be used to 
 connect successfully to the database.
DisplayName : Test the database can be reached.
InteractionModel : Synchronous
TargetObjectType : 
TestId : Configuration_DatabaseCanBeReached
TestScope : ServiceInstance
TestSuiteIds : {Infrastructure}

TestSuites are groups of tests executed in succession to validate groups of component, as well as their interactions and workflows. The Get-EnvTestSuite cmdlet returns a list of test suite definitions, and can be used to find out what tests a suite is comprised of. To get a list of TestSuiteIDs, for example, you can run a Get-EnvTestSuite | Select TestSuiteID, which returns all of the available test suites:

TestSuiteId 
----------- 
Infrastructure 
DesktopGroup 
Catalog 
HypervisorConnection 
HostingUnit 
MachineCreation_ProvisioningScheme_Basic 
MachineCreation_ProvisioningScheme_Collaboration 
MachineCreation_Availability 
MachineCreation_Identity_State 
MachineCreation_VirtualMachine_State 
ADIdentity_IdentityPool_Basic 
ADIdentity_IdentityPool_Provisioning 
ADIdentity_WhatIf 
ADIdentity_Identity_Available 
ADIdentity_Identity_State

Each of these suites can be queried using the same cmdlet, and passing the -TestSuiteID of the suite in question. Let’s take DesktopGroup as an example:

PS C:\> Get-EnvTestSuiteDefinition -TestSuiteId DesktopGroup

TestSuiteId         Tests 
-----------                  ----- 
DesktopGroup   Check hypervisor connection, Check connection maintenance mode, Ch...

One thing you’ll notice with the results of this cmdlet is that the list of tests are truncated, which is a result of the default stdout formatting in the PowerShell console. For that reason, my preferred method of looking at objects with large strings (ie descriptions) in PowerShell, is to view them in a graphical ISE (PowerGUI is my preference) and explore the objects in the ‘Variables’ pane.

For example, if you store the results of  Get-EnvTestSuiteDefinition -TestSuiteId DesktopGroup into a variable ($dgtest) in PowerGUI, each Test object that comprises the test suite can be inspected individually:

The DesktopGroup EnvTestSuite object

The DesktopGroup EnvTestSuite object

To start a test task, use the Start-EnvTestTask, passing the TestID or, alternatively, the TestSuiteID, and a target object (as needed). For example:

PS C:> Start-EnvTestTask -TestId Configuration_DatabaseCanBeReached

Active : False
ActiveElapsedTime : 11
CompletedTests : 1
CompletedWorkItems : 11
CurrentOperation : 
DateFinished : 9/16/2013 11:33:31 PM
DateStarted : 9/16/2013 11:33:20 PM
DiscoverRelatedObjects : True
DiscoveredObjects : {}
ExtendedProperties : {}
Host : 
LastUpdateTime : 9/16/2013 11:33:31 PM
Metadata : {}
MetadataMap : {}
Status : Finished
TaskExpectedCompletion : 
TaskId : 03f5480d-68e8-410a-9da4-5e65d96ac393
TaskProgress : 100
TerminatingError : 
TestIds : {Configuration_DatabaseCanBeReached}
TestResults : {Configuration_DatabaseCanBeReached}
TestSuiteIds : {}
TotalPendingTests : 1
TotalPendingWorkItems : 11
Type : EnvironmentTestRun

Once you know what tests there are, what they do, and what types of results to expect, health check scripts can easily be created using this service. Combinations of tests and test suites can, and should, be leveraged as needed to systematically validate XenDesktop 7 site components and functionality.

I plan on using these cmdlets to some extent in SiteDiag, and expect to get some good use out of this new service in the field. I’m interested to hear from anyone else who’s started using this snap-in, and if they’ve come up with any useful scripts.